確率分布をRで描いた
基本的な確率分布をRで描いてみた。
二項分布
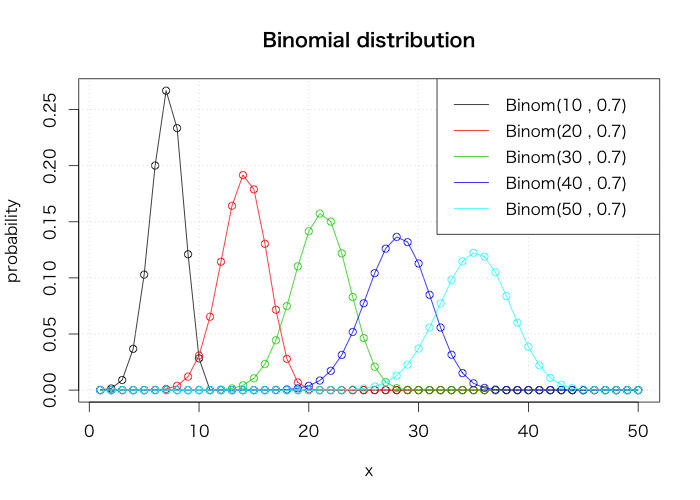
plot(dbinom(1:50, 10, 0.7), type="o", xlab="x", ylab="probability", main="Binomial distribution")
for(i in 2:5) {
  points(dbinom(1:50, i*10, 0.7), col=i)
  lines(dbinom(1:50, i*10, 0.7), col=i)
}
grid()
legend("topright", legend=paste0("Binom(", seq(10, 50, 10), " , 0.7)"), col=1:5, lty=1)
ポアソン分布

plot(dpois(0:19, 1), type="o", xlab="x", ylab="probability", main="Poisson distribution")
for(i in 2:5) {
  points(dpois(0:19, i*2), col=i)
  lines(dpois(0:19, i*2), col=i)
}
grid()
legend("topright", legend=paste0("Pois(", c(1, (2:5)*2), ")"), col=1:5, lty=1)
正規分布

curve(dnorm(x), from=-7, to=10, n=202, xlab="x", ylab="probability", main="Normal distribution")
curve(dnorm(x, 5, 1), from=-7, to=10, n=202, col=2, add=T)
curve(dnorm(x, 0, 2), from=-7, to=10, n=202, col=3, add=T)
grid()
legend("topleft", legend=paste0("Norm(", c(0, 5, 0), " , ", c(1, 1, 4), ")"), col=1:3, lty=1)
指数分布
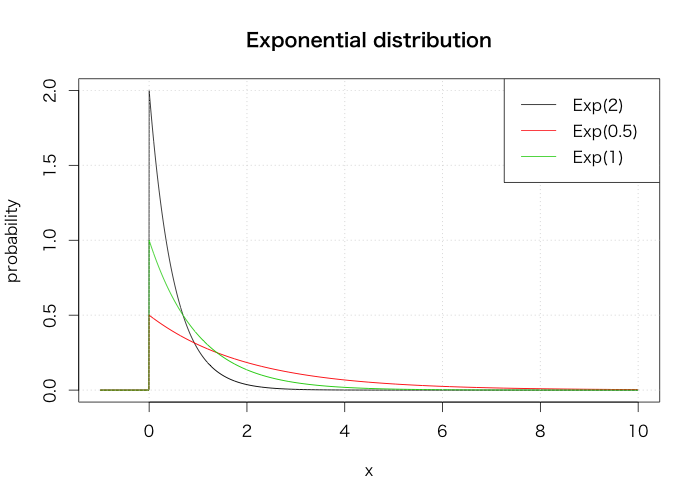
curve(dexp(x, 2), from=-1, to=10, n=2002, xlab="x", ylab="probability", main="Exponential distribution")
curve(dexp(x, 0.5), from=-1, to=10, n=2002, col=2, add=T)
curve(dexp(x), from=-1, to=10, n=2002, col=3, add=T)
grid()
legend("topright", legend=paste0("Exp(", c(2, 0.5, 1), ")"), col=1:3, lty=1)
ガンマ分布
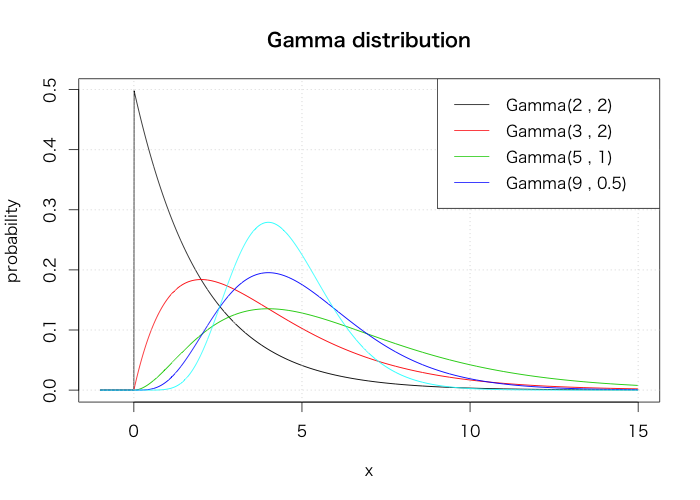
curve(dgamma(x, 1, scale=2), from=-1, to=15, n=2002, xlab="x", ylab="probability", main="Gamma distribution")
sh <- c(2, 3, 5, 9)
sc <- c(2, 2, 1, 0.5)
for(i in 2:5) {
  curve(dgamma(x, sh[i-1], scale=sc[i-1]), from=-1, to=15, n=2002, col=i, add=T)
}
grid()
legend("topright", legend=paste0("Gamma(", sh, " , ", sc, ")"), col=1:5, lty=1)
カイ二乗分布
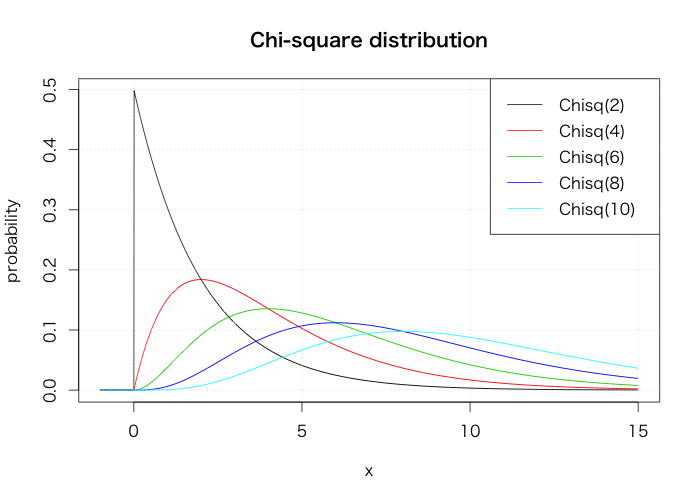
curve(dchisq(x, 2), from=-1, to=15, n=2002, xlab="x", ylab="probability", main="Chi-square distribution")
for(i in 2:5) {
  curve(dchisq(x, i*2), from=-1, to=15, n=2002, col=i, add=T)
}
grid()
legend("topright", legend=paste0("Chisq(", 1:5*2, ")"), col=1:6, lty=1)
Student's t分布
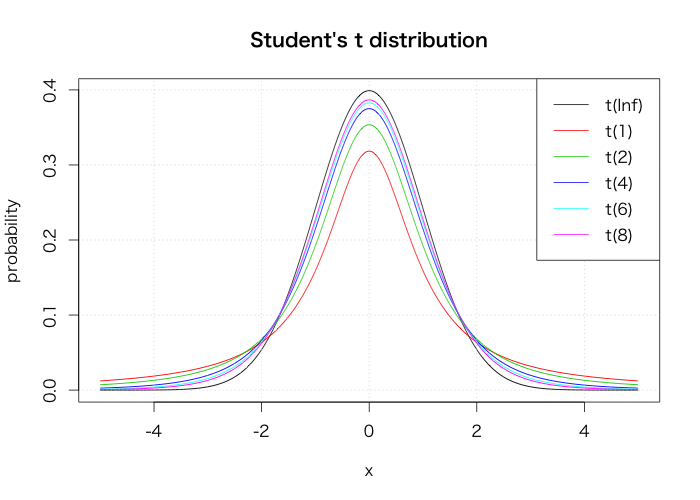
curve(dt(x, Inf), from=-5, to=5, n=2002, xlab="x", ylab="probability", main="Student's t distribution")
curve(dt(x, 1), from=-5, to=5, n=2002, col=2, add=T)
for(i in 1:4) {
  curve(dt(x, i*2), from=-5, to=5, n=2002, col=i+2, add=T)
}
grid()
legend("topright", legend=paste0("t(", c(Inf, 1, 1:4*2), ")"), col=1:6, lty=1)
ベータ分布

a <- c(5, 2, 1, 0.5, 0.1)
curve(dbeta(x, a[1], a[1]), from=-0.1, to=1.7, n=2002, xlab="x", ylab="probability", main="Beta distribution")
for(i in 2:5) {
  curve(dbeta(x, a[i], a[i]), from=-0.1, to=1.7, n=2002, col=i, add=T)
}
grid()
legend("topright", legend=paste0("Beta(", a, " , ", a, ")"), col=1:5, lty=1)
一様分布
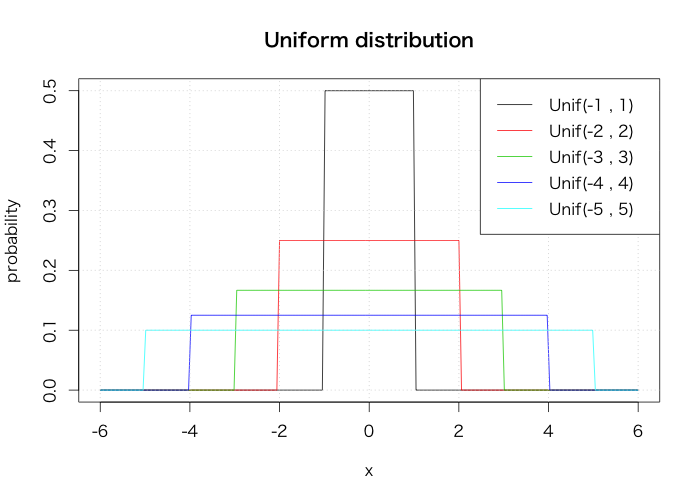
curve(dunif(x, -1, 1), from=-6, to=6, n=202, xlab="x", ylab="probability", main="Uniform distribution")
for(i in 2:5) {
  curve(dunif(x, -i, i), from=-6, to=6, n=202, col=i, add=T)
}
grid()
legend("topright", legend=paste0("Unif(", -1:-5, " , ", 1:5, ")"), col=1:6, lty=1)
対数正規分布
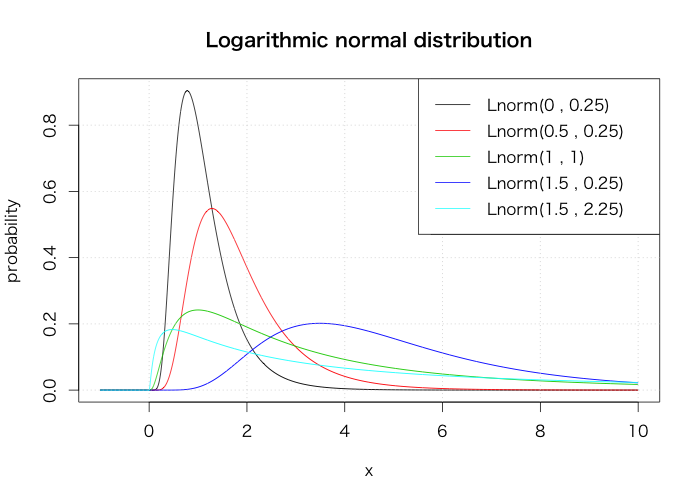
mu <- c(0, 0.5, 1, 1.5, 1.5)
sigma <- c(0.5, 0.5, 1, 0.5, 1.5)
curve(dlnorm(x, mu[1], sigma[1]), from=-1, to=10, n=2002, xlab="x", ylab="probability", main="Logarithmic normal distribution")
for(i in 2:5) {
  curve(dlnorm(x, mu[i], sigma[i]), from=-1, to=10, n=2002, col=i, add=T)
}
grid()
legend("topright", legend=paste0("Lnorm(", mu, " , ", sigma, ")"), col=1:5, lty=1)