Rで(逆)ジオコーディング
今回はGoogle Geocoding APIを利用して、住所から緯度経度(及びその逆)を求めたいと思います。
APIについて
Google Geocoding APIはGoogleの提供するAPIで、1日2500件までリクエストが可能です。リクエストにはいくつか形式を選択する必要があります。
必須パラメータ
- address : 変換する住所。
- latlng : 変換する緯度経度。ここに最も近い住所を取得する。
- components : 特定の地域に制限した住所を指定する。詳しくは公式ページへ
- sensor : リクエストが場所センサー搭載のデバイスからのものかどうかをtrueかfalseで指定する。
上3つはどれかがあれば良いです。その他のパラメータについては省略です。
ジオコーディング
以下に示すようにRコードを組みます。東京ドームの緯度経度を簡潔に求めたいと思います。
### ライブラリのロード
require(rjson)
require(RCurl)

### Queryの作成
# 変換したい住所
address <- "東京都文京区後楽1-3-61"
# UTF-8形式のQuery作成
Query <- paste0("http://maps.googleapis.com/maps/api/geocode/json?address=", address, "&sensor=false")
Query_utf8 <- URLencode(iconv(Query, "", "UTF-8"))

### URLからJSONデータを取得し、リスト形式に変換
getJSON <- fromJSON(getURL(Query_utf8))
ここまでくれば、後は欲しい情報を得たデータから探すだけです。
このデータには精度などの情報もありますが、単純に緯度経度が欲しいだけなら以下でokです。
getJSON$results[[1]]$geometry$location
## $lat
## [1] 35.70466
##
## $lng
## [1] 139.7533
##
逆ジオコーディング
基本的にはジオコーディングと変わりません。
Queryのパラメータをaddressの代わりにlatlngにしてあげれば、入力を緯度経度としてリクエストできます。
### ライブラリのロード require(rjson) require(RCurl) ### Queryの作成 # 変換したい緯度経度 latlng <- c(35.70466, 139.7533) # UTF-8形式のQuery作成 Query <- paste0("http://maps.googleapis.com/maps/api/geocode/json?latlng=", paste(latlng, collapse = ","), "&sensor=false&language=ja®ion=JP") Query_utf8 <- URLencode(iconv(Query, "", "UTF-8")) ### URLからJSONデータを取得し、リスト形式に変換 getJSON <- fromJSON(getURL(Query_utf8))
これに関しても、詳細は省いて住所のみを取り出す場合は以下を実行すれば良いです。
getJSON$results[[1]]$formatted_address
## [1] "日本, 〒112-8562 東京都文京区後楽1丁目3−61"
関数化
どうせなので、関数にしました。
para引数には、APIに可能なパラメータを入れます。またproxy引数を設定することでproxy環境下でも実行可能にしています。
こちらがジオコーディング。住所から緯度経度に変換します。
require(rjson)
require(RCurl)
### 関数定義
GEO <- function(address, para = list(sensor = "false", language = "ja", region = "JP"), proxy = NULL) {
  curl_set <- getCurlHandle()
  if(!is.null(proxy)) curlSetOpt(.opts = list(proxy = proxy), curl = curl_set)
  parameters <- paste0("&", names(para), "=", unname(unlist(para)), collapse = "")
  GeoRequest <- iconv(paste0("http://maps.googleapis.com/maps/api/geocode/json?address=", address, parameters), "", "UTF-8")
  geodata <- vector("list", length(address))
  for(i in seq_along(address)) {
    getJSON <- fromJSON(getURL(URLencode(GeoRequest[i]), curl = curl_set))
    geodata[[i]] <- as.data.frame(getJSON$results[[1]]$geometry$location)
  }
  cbind(address, do.call("rbind", geodata))
}
### 実行
GEO(address = c("東京都文京区後楽1-3-61", "東京都墨田区押上1-1-13"))
##                  address      lat      lng
## 1 東京都文京区後楽1-3-61 35.70466 139.7533
## 2 東京都墨田区押上1-1-13 35.71004 139.8118
そしてこちらが逆ジオコーディング。緯度経度から住所に変換します。
require(rjson)
require(RCurl)
### 関数定義
rGEO <- function(latlng, para = list(sensor = "false", language = "ja", region = "JP"), proxy = NULL) {
  curl_set <- getCurlHandle()
  if(!is.null(proxy)) curlSetOpt(.opts = list(proxy = proxy), curl = curl_set)
  parameters <- paste0("&", names(para), "=", unname(unlist(para)), collapse = "")
  GeoRequest <- iconv(paste0("http://maps.googleapis.com/maps/api/geocode/json?latlng=", latlng[, 1], ",", latlng[, 2], parameters), "", "UTF-8")
  geodata <- vector("list", nrow(latlng))
  for(i in 1:nrow(latlng)) {
    getJSON <- fromJSON(getURL(URLencode(GeoRequest[i]), curl = curl_set))
    geodata[[i]] <- data.frame(address = getJSON$results[[1]]$formatted_address)
  }
  cbind(latlng, do.call("rbind", geodata))
}
### 実行
rGEO(latlng = data.frame(lat = c(35.70466, 35.71004), lon = c(139.7533, 139.8118)))
##        lat      lon                                        address
## 1 35.70466 139.7533 日本, 〒112-8562 東京都文京区後楽1丁目3−61
## 2 35.71004 139.8118            日本, 東京都墨田区業平2丁目18−1
RでChangeFinder
変化点検出のアルゴリズムとして、ChangeFinderという有名なアルゴリズムがあります。Rによる実装例が見つからなかったので実装しました。今回は1次元のデータに対する変化点検出を考えます。アルゴリズムの詳細は記述しませんので、後述の参考群を参照してください。
実装
まず、準備として予め2つの関数を定義しておきます。
1つ目は、アルゴリズム内で用いる平滑化用の関数です。
2つ目は、擬似逆行列を計算する関数です。計算上、逆行列が存在しない場合もありますので、擬似逆行列を計算する必要があります。今回はムーア・ペンローズ逆行列を実装しています。
## 平滑化用関数
MW <- function(dat, width, na.rm = TRUE) {
  N <- length(dat)
  x <- numeric(N)
  for(i in 1L:(width-1L)) {
    x[i] <- mean(dat[1L:i], na.rm = na.rm)
  }
  for(i in width:N) {
    x[i] <- mean(dat[(i-width+1L):i], na.rm = na.rm)
  }
  return(x)
}
## 擬似逆行列計算用関数(MASSパッケージより)
ginv <- function (X, tol = sqrt(.Machine$double.eps)) {
  if (length(dim(X)) > 2L || !(is.numeric(X) || is.complex(X)))
    stop("'X' must be a numeric or complex matrix")
  if (!is.matrix(X))
    X <- as.matrix(X)
  Xsvd <- svd(X)
  if (is.complex(X))
    Xsvd$u <- Conj(Xsvd$u)
  Positive <- Xsvd$d > max(tol * Xsvd$d[1L], 0)
  if (all(Positive))
    Xsvd$v %*% (1/Xsvd$d * t(Xsvd$u))
  else if (!any(Positive))
    array(0, dim(X)[2L:1L])
  else Xsvd$v[, Positive, drop = FALSE] %*% ((1/Xsvd$d[Positive]) * t(Xsvd$u[, Positive, drop = FALSE]))
}
ChangeFinderの要の部分になります。ARで定めた時系列モデルからの逸脱度を計算します。さらにこのアルゴリズムはオンラインアルゴリズムであるため、忘却係数を用いたパラメータの更新も行います。スコア計算には対数損失を用いています。
SDAR1 <- function(x, ar_order, forgetting, mu = 0, co = numeric(ar_order+1), w = numeric(ar_order), S = 0) {
  N <- length(x)
  score <- numeric(N)
  for(t in (ar_order+1L):N) {
    mu <- (1-forgetting)*mu + forgetting*x[t]
    co <- (1-forgetting)*co + forgetting*(x[t]-mu)*(x[t-(0:ar_order)]-mu)
    w <- c(ginv(matrix(co[abs(rep(1:ar_order, ar_order)-rep(1:ar_order, each=ar_order))+1], ar_order, ar_order)) %*% co[-1])
    x_hat <- c(w %*% (x[t-(1:ar_order)]-mu)) + mu
    S <- (1-forgetting)*S + forgetting*(x[t]-x_hat)^2
    score[t] <- (log(2*pi*S) + (x[t] - x_hat)^2 / S) / 2
  }
  list(Score = score, x = x)
}
いよいよChangeFinderアルゴリズムの完成になります。SDARと平滑化を繰り返すのみですので、ここは簡潔に済みます。
またここで、パラメータの第1Step・第2Stepの初期値をどうするかという問題があるのですが今回はすべて0としています。
CF <- function(x, ar_order, forgetting, width1, width2 = width1, na.rm = TRUE) {
  Step1 <- SDAR1(x, ar_order, forgetting)$Score
  Step2 <- MW(Step1, width1, na.rm)
  Step3 <- MW(SDAR1(Step2, ar_order, forgetting)$Score, width2, na.rm)
  return(Step3)
}
適用例
シミュレーションにはF# でオンライン変化点検知 - 捨てられたブログの例を利用しています。
x <- c(rnorm(300, 0.7, 0.05),
       rnorm(300, 1.5, 0.05),
       rnorm(300, 0.6, 0.05),
       rnorm(300, 1.3, 0.05))
CF_test <- CF(x, 1, 0.01, 7, 7)
plot(x, col = rep(c(1:2, 1:2), each = 300), ylim = range(x, CF_test))
lines(CF_test, col = 4)
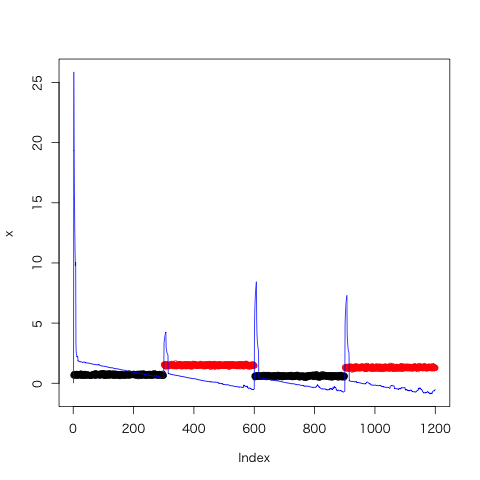
青線を変化点スコア、黒点及び赤点を時系列データとしています。上図を見ると変化点スコアが初めの方で大きく伸びていますが、これはパラメータの初期値が関係しています。対策としては、時系列データの幾分かを学習データとして与えることでスコアをより適切にすることができます。
参考
- 変化点検出 ChangeFinder
- F# でオンライン変化点検知 - 捨てられたブログ
- changefinder - Argmax.jp
- 一般逆行列・ムーア・ペンローズ逆行列 - 大人になってからの再学習

- 作者: 山西健司
- 出版社/メーカー: 共立出版
- 発売日: 2009/05/23
- メディア: 単行本
- 購入: 3人 クリック: 29回
- この商品を含むブログ (5件) を見る
Rで単純パーセプトロンを組んでみた
SVMを実装するにあたって「まずパーセプトロンを組んでみては?」と先輩からアドバイスを頂いたので、実装してみた。パーセプトロンに関するまとめ付き。
機械学習としてのパーセプトロン
- 識別関数
- 入力データを見て、特定のクラスに属するように識別する
- 識別モデル
- 入力データからクラス事後確率をモデル化して識別する
- 生成モデル
- 入力データが生成される確率分布をモデル化して識別する
また今後学ぶSVMは(大雑把に言うと)、このパーセプトロンという識別関数に「マージン最大化」と「カーネル関数」を取り入れたものであるらしい。
パーセプトロンとは
パーセプトロンは2クラスのクラス分類器のこと。どんな識別関数かというと、下式で表すような線形識別関数である。
は重みベクトル、
は入力ベクトルであり、これらの内積が0より小さいかそれ以上かでクラス分類をしている。この説明だともしかしたら下式の方が理解しやすいかもしれないので、こちらも示しておく。
パーセプトロンではこの重みベクトルを変化させることで、適切なクラス分類をしたい。
入力データの教師ラベルが、クラス1(
)の時+1、クラス2(
)のとき-1であるとすると、正しく分類されていることは下の条件を満たすことに等しい。
これらをまとめると、下式で表すことができる。
さて、この式によってどのデータを誤判別しているかどうかがわかるようになったので、次は誤判別しているデータがどのくらい分離超平面と距離があるのかを考えることで、分離超平面の「ズレ」具合を数値として求める。パーセプトロンでは、この「ズレ」具合をヒンジ損失関数を用いて以下のように表す。(
はステップ数)
さらにこれを用いて、に関する誤差関数(パーセプトロン規準*2)を求める。
この誤差関数は誤判別データからの「ズレ」の和であるから、これを最小化するようなを求めることができれば、適切にデータを分類できるかもしれない。誤差関数の最小化には、確率的最急降下法(詳しくはここ)より下式を用いて
を逐次的に更新する。
なお、は学習係数を表す。
オンライン学習云々については機会があればということで、ここでは省略。
Rによる実装
関数として作成。上では説明していないが、バイアス項も重みベクトルとして含めた。
# mu = 学習係数
perceptron  <- function(x, label, eps=1e-10, mu=0.5, int=0) {
  if(ncol(x)==1 || is.vector(x)) {
    x <- cbind(x, 0, 1)
  }
  else if(ncol(x)==2) {
    x <- cbind(x, 1)
  }
  w <- rep(0, 2)
  k <- 0L
  upperlimit <- TRUE
  x1 <- x[sign(label)==1, 1:2]
  x2 <- x[sign(label)==-1, 1:2]
  plot(x1, xlim=range(x[, 1]), ylim=range(x[, 2]), xlab="x", ylab="y", col=2)
  points(x2, col=3)
  abline(a=w[2], b=w[1], col=gray(0.8))
  while(upperlimit) {
    for(i in 1:nrow(x)) {
      # 学習部 (+ α) <-- ここから
      if((label[i]*((w %*% x[i, c(1, 3)])[1] - x[i, 2])) <= 0) {
        w <- w + mu * label[i] * x[i, c(1, 3)]
        k <- k + 1L
        Sys.sleep(int)
        abline(a=w[2], b=w[1], col=gray(0.8))
      }
      # ここまで -->
    }
    # 終了判定 <-- ここから
    # パーセプトロン規準 <= eps なら終了
    lim <- w[1] * x[, 1] + w[2] * x[, 3] - x[, 2]
    lim <- sum(max(0, -label * lim) / norm(c(w, -1), "2"))
    if(lim <= eps) {
      upperlimit <- FALSE
    }
    # ここまで -->
  }
  abline(a=w[2], b=w[1])
  return(list("intercept"=as.numeric(w[2]),
              "coefficient"=as.numeric(w[1]),
              "iteration"=k,
              "residuals"=lim))
}
実行結果
完成したperceptron関数を1次元と2次元に対して実行してみた。
1次元
まずは0~10にばらつく10個の一様乱数に対しての判別から。ラベルは平均より大きいか小さいかで付けている。
x <- runif(10, 0, 10)
perceptron(x=x, label=sign(mean(x)-x))
実行結果と図は以下のとおり。
$intercept
[1] 4.500000

$coefficient
[1] -1.157935

$iteration
[1] 19

$residuals
[1] 0
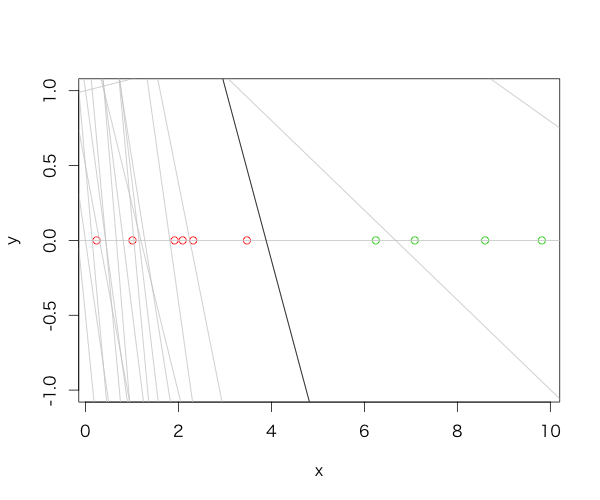
灰色の線は学習途中の分離超平面を表し、黒線が学習完了後の分離超平面を表す。
2次元
0~1にばらつく100個の一様乱数と、1~2にばらつく100個の一様乱数を分類させた。
N <- 100
x <- rbind(matrix(runif(2*N, 0, 1), nc=2), matrix(runif(2*N, 1, 2), nc=2))
perceptron(x=x, label=rep(c(1, -1), each=N))
実行結果と図は以下。
$intercept
[1] 1.5000000

$coefficient
[1] -0.4656081

$iteration
[1] 13

$residuals
[1] 0
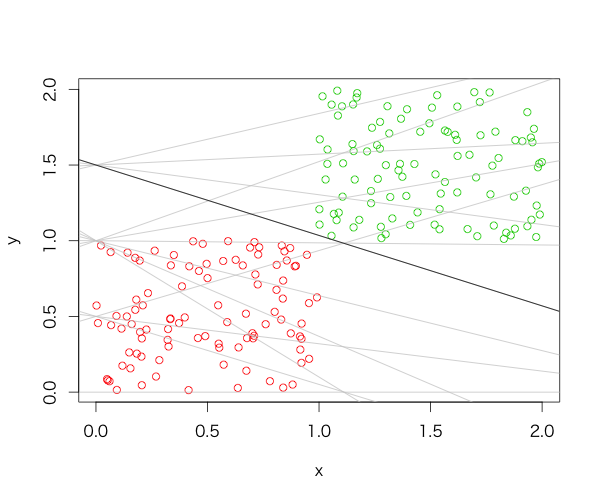
最適とは言えなそうではあるが、入力データに対してはしっかり分類できている様子がわかる。
参考
- テキストマイニングのための機械学習超入門 二夜目 パーセプトロン - あんちべ!
- 単純パーセプトロンをPythonで組んでみる - 銀座で働くデータサイエンティストのブログ
- パーセプトロン - 機械学習の「朱鷺の杜Wiki」
- 機械学習超入門III 〜機械学習の基礎、パーセプトロンを30分で作って学ぶ〜 - EchizenBlog-Zwei

- 作者: C.M.ビショップ,元田浩,栗田多喜夫,樋口知之,松本裕治,村田昇
- 出版社/メーカー: 丸善出版
- 発売日: 2012/04/05
- メディア: 単行本(ソフトカバー)
- 購入: 6人 クリック: 33回
- この商品を含むブログ (16件) を見る
*2:Widrow-Hoffの学習規則という規準もある
確率分布をRで描いた
基本的な確率分布をRで描いてみた。
二項分布
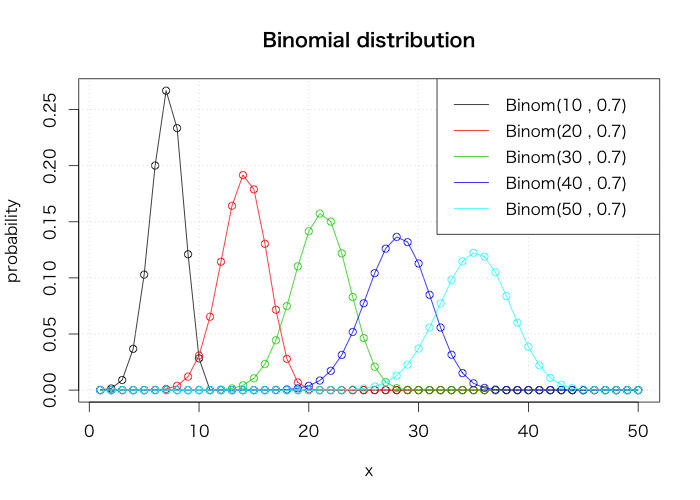
plot(dbinom(1:50, 10, 0.7), type="o", xlab="x", ylab="probability", main="Binomial distribution")
for(i in 2:5) {
  points(dbinom(1:50, i*10, 0.7), col=i)
  lines(dbinom(1:50, i*10, 0.7), col=i)
}
grid()
legend("topright", legend=paste0("Binom(", seq(10, 50, 10), " , 0.7)"), col=1:5, lty=1)
ポアソン分布

plot(dpois(0:19, 1), type="o", xlab="x", ylab="probability", main="Poisson distribution")
for(i in 2:5) {
  points(dpois(0:19, i*2), col=i)
  lines(dpois(0:19, i*2), col=i)
}
grid()
legend("topright", legend=paste0("Pois(", c(1, (2:5)*2), ")"), col=1:5, lty=1)
正規分布

curve(dnorm(x), from=-7, to=10, n=202, xlab="x", ylab="probability", main="Normal distribution")
curve(dnorm(x, 5, 1), from=-7, to=10, n=202, col=2, add=T)
curve(dnorm(x, 0, 2), from=-7, to=10, n=202, col=3, add=T)
grid()
legend("topleft", legend=paste0("Norm(", c(0, 5, 0), " , ", c(1, 1, 4), ")"), col=1:3, lty=1)
指数分布
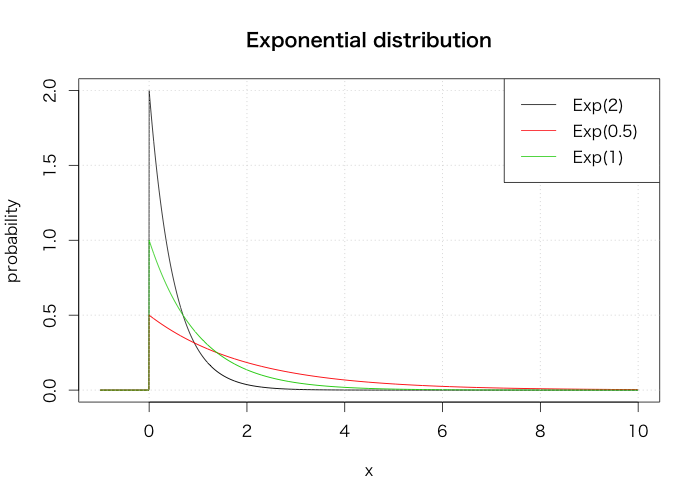
curve(dexp(x, 2), from=-1, to=10, n=2002, xlab="x", ylab="probability", main="Exponential distribution")
curve(dexp(x, 0.5), from=-1, to=10, n=2002, col=2, add=T)
curve(dexp(x), from=-1, to=10, n=2002, col=3, add=T)
grid()
legend("topright", legend=paste0("Exp(", c(2, 0.5, 1), ")"), col=1:3, lty=1)
ガンマ分布
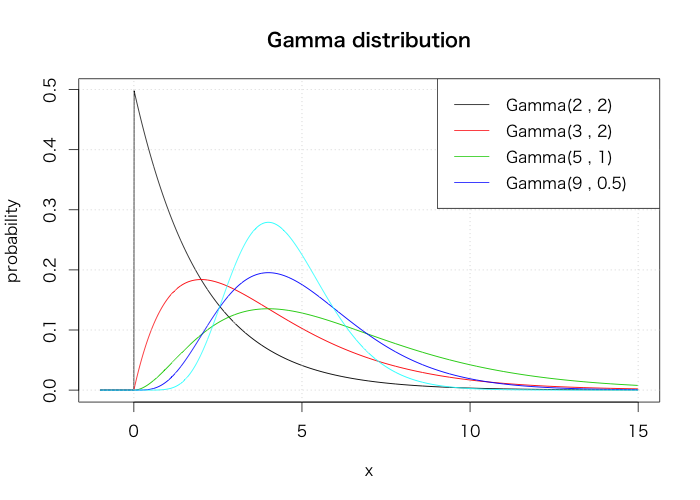
curve(dgamma(x, 1, scale=2), from=-1, to=15, n=2002, xlab="x", ylab="probability", main="Gamma distribution")
sh <- c(2, 3, 5, 9)
sc <- c(2, 2, 1, 0.5)
for(i in 2:5) {
  curve(dgamma(x, sh[i-1], scale=sc[i-1]), from=-1, to=15, n=2002, col=i, add=T)
}
grid()
legend("topright", legend=paste0("Gamma(", sh, " , ", sc, ")"), col=1:5, lty=1)
カイ二乗分布
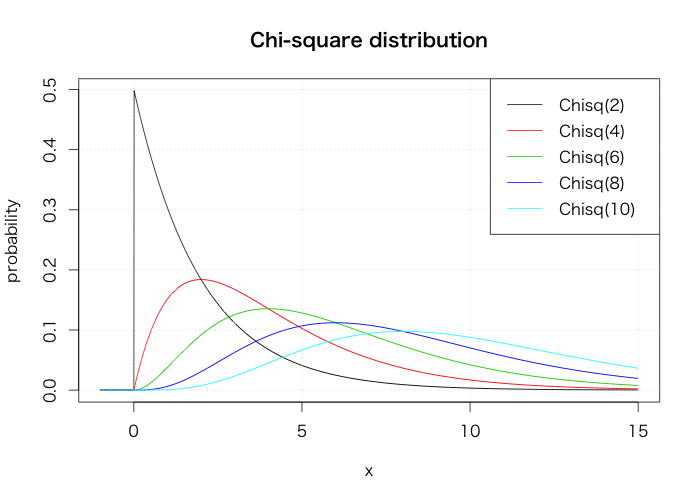
curve(dchisq(x, 2), from=-1, to=15, n=2002, xlab="x", ylab="probability", main="Chi-square distribution")
for(i in 2:5) {
  curve(dchisq(x, i*2), from=-1, to=15, n=2002, col=i, add=T)
}
grid()
legend("topright", legend=paste0("Chisq(", 1:5*2, ")"), col=1:6, lty=1)
Student's t分布
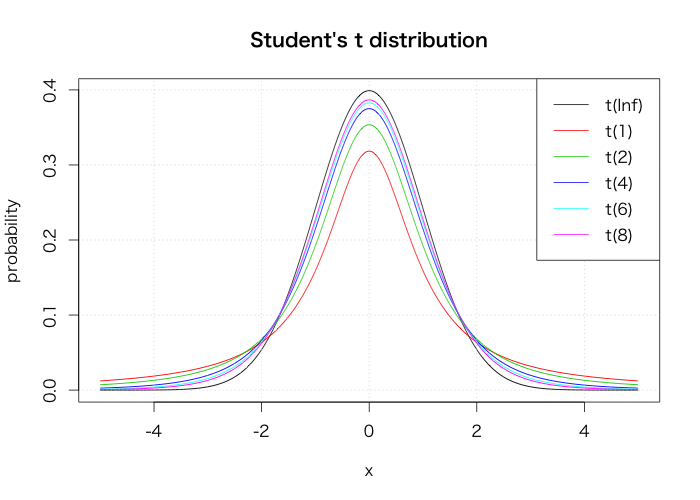
curve(dt(x, Inf), from=-5, to=5, n=2002, xlab="x", ylab="probability", main="Student's t distribution")
curve(dt(x, 1), from=-5, to=5, n=2002, col=2, add=T)
for(i in 1:4) {
  curve(dt(x, i*2), from=-5, to=5, n=2002, col=i+2, add=T)
}
grid()
legend("topright", legend=paste0("t(", c(Inf, 1, 1:4*2), ")"), col=1:6, lty=1)
ベータ分布

a <- c(5, 2, 1, 0.5, 0.1)
curve(dbeta(x, a[1], a[1]), from=-0.1, to=1.7, n=2002, xlab="x", ylab="probability", main="Beta distribution")
for(i in 2:5) {
  curve(dbeta(x, a[i], a[i]), from=-0.1, to=1.7, n=2002, col=i, add=T)
}
grid()
legend("topright", legend=paste0("Beta(", a, " , ", a, ")"), col=1:5, lty=1)
一様分布
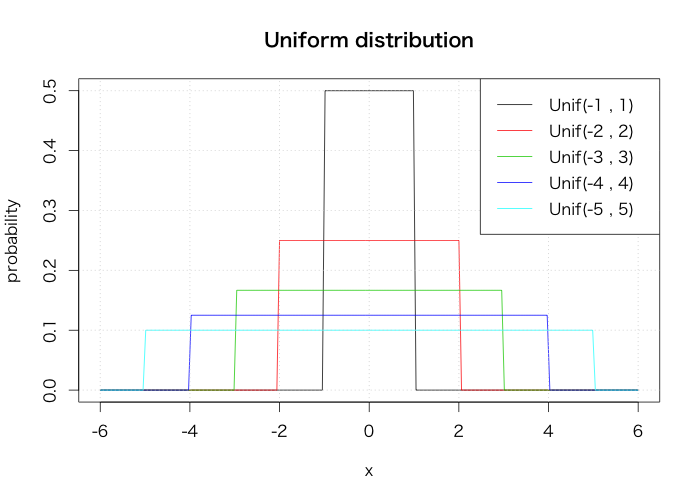
curve(dunif(x, -1, 1), from=-6, to=6, n=202, xlab="x", ylab="probability", main="Uniform distribution")
for(i in 2:5) {
  curve(dunif(x, -i, i), from=-6, to=6, n=202, col=i, add=T)
}
grid()
legend("topright", legend=paste0("Unif(", -1:-5, " , ", 1:5, ")"), col=1:6, lty=1)
対数正規分布
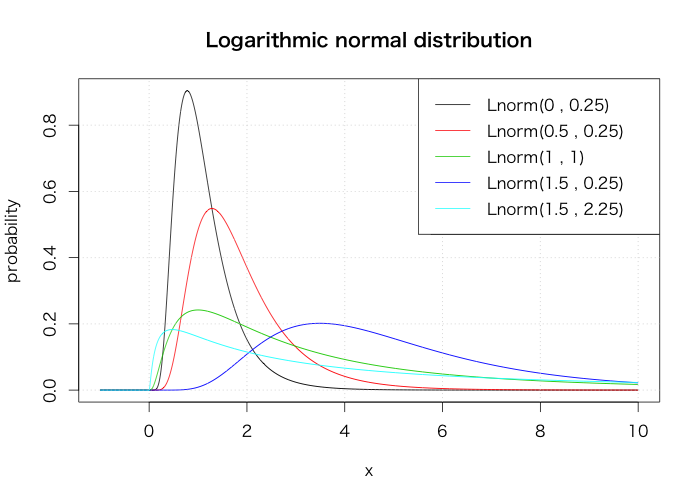
mu <- c(0, 0.5, 1, 1.5, 1.5)
sigma <- c(0.5, 0.5, 1, 0.5, 1.5)
curve(dlnorm(x, mu[1], sigma[1]), from=-1, to=10, n=2002, xlab="x", ylab="probability", main="Logarithmic normal distribution")
for(i in 2:5) {
  curve(dlnorm(x, mu[i], sigma[i]), from=-1, to=10, n=2002, col=i, add=T)
}
grid()
legend("topright", legend=paste0("Lnorm(", mu, " , ", sigma, ")"), col=1:5, lty=1)
fread(data.table 1.9.2)の引数sep2が使えない
これは本当に題意のとおりで、割とつまづいたのでメモ。
まずfread関数とは、高速にデータテーブルを読み込んでくれる
data.tableパッケージの関数のことです。
区切り文字などを指定しなくても自動で対応したり、列選択ができるなど、
高速さ以外にも便利だったのですが、問題発生です。
sep2という改行コードを操作する引数があるのですが、これをどのように変更しても
改行コードが変更されず、正しくデータが読み込めませんでした。
「sep2="\r\n"という表記が悪いのか???」
色々試しましたが、何しても変更されない上、そもそもエラーすら出ないという...
というわけで中身を拝見。
function (input = "test.csv", sep = "auto", sep2 = "auto", nrows = -1L,
    header = "auto", na.strings = "NA", stringsAsFactors = FALSE,
    verbose = FALSE, autostart = 30L, skip = -1L, select = NULL,
    drop = NULL, colClasses = NULL, integer64 = getOption("datatable.integer64"),
    showProgress = getOption("datatable.showProgress"))
{
    if (!is.character(input) || length(input) != 1) {
        stop("'input' must be a single character string containing a file name, a command, full path to a file, a URL starting 'http://' or 'file://', or the input data itself")
    }
    else if (substring(input, 1, 7) %chin% c("http://", "https:/",
        "file://")) {
        tt = tempfile()
        on.exit(unlink(tt), add = TRUE)
        download.file(input, tt)
        input = tt
    }
    else if (input == "" || length(grep("\\n|\\r", input)) >
        0) {
    }
    else if (!file.exists(input)) {
        tt = tempfile()
        on.exit(unlink(tt), add = TRUE)
        if (.Platform$OS.type == "unix") {
            if (file.exists("/dev/shm") && file.info("/dev/shm")$isdir) {
                tt = tempfile(tmpdir = "/dev/shm")
            }
            system(paste("(", input, ") > ", tt, sep = ""))
        }
        else {
            shell(paste("(", input, ") > ", tt, sep = ""))
        }
        input = tt
    }
    if (identical(header, "auto"))
        header = NA
    if (identical(sep, "auto"))
        sep = NULL
    if (is.atomic(colClasses) && !is.null(names(colClasses)))
        colClasses = tapply(names(colClasses), colClasses, c,
            simplify = FALSE)
    ans = .Call(Creadfile, input, sep, as.integer(nrows), header,
        na.strings, verbose, as.integer(autostart), skip, select,
        drop, colClasses, integer64, as.integer(showProgress))
    nr = length(ans[[1]])
    setattr(ans, "row.names", .set_row_names(nr))
    setattr(ans, "class", c("data.table", "data.frame"))
    if (integer64 == "integer64" && !exists("print.integer64") &&
        any(sapply(ans, inherits, "integer64")))
        warning("Some columns have been read as type 'integer64' but package bit64 isn't loaded. Those columns will display as strange looking floating point data. There is no need to reload the data. Just require(bit64) to obtain the integer64 print method and print the data again.")
    alloc.col(ans)
}
sep2が引数にあるのに使われてない!!??
原因が判明したという点では一件落着。。
まだまだ発展途上ということなんですかね。
でもそれなら引数に入れないか、詳細をREADMEに書くくらいはしてほしいですね。
(7/29追記)
helpマニュアルをよーく見たらあった...
「The separator within columns. A list column will be returned where each cell is a vector of values. This is much faster using less working memory than strsplit afterwards or similar
techniques. For each column sep2 can be different and is the first character in the same set above [,\t |;:], other than sep, that exists inside each field outside quoted regions on line autostart. NB: sep2 is not yet implemented.」
最後に未実装って書いてあったなんて。完全に見逃してた。